The ESG Reporting Season Starts Now. Why Organisations Should Not Wait Until Year End
With only half a year left, is it time to start preparing ESG reporting data?
Mid-year is often the time when many organisations have only just begun to catch their breath after the annual reporting and sustainability reporting season. For many companies, the annual report and sustainability report were only recently finalised, submitted, and published during the first quarter.
But for teams responsible for ESG data or Sustainability Report development, the important question is this: should we wait until year-end before starting to collect ESG data again?
The answer is no.
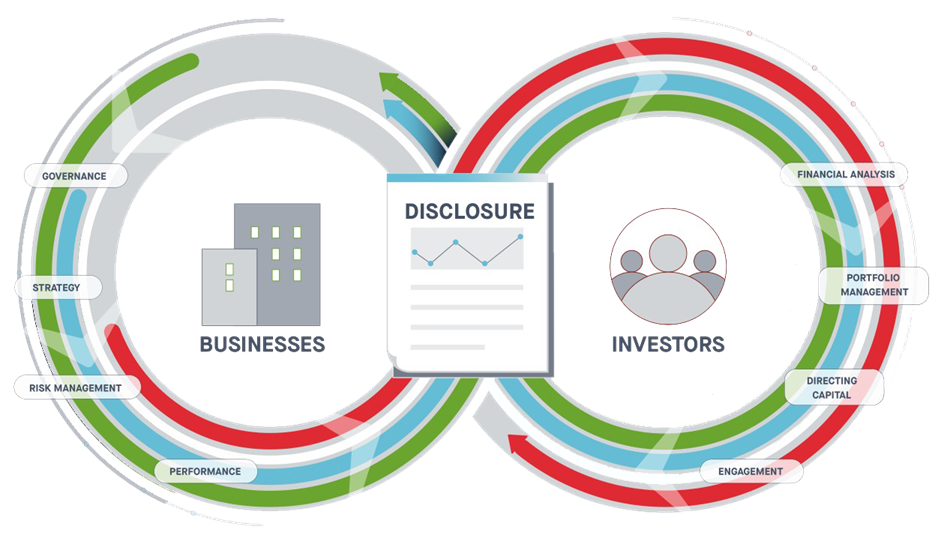
ESG reporting today is no longer simply about compiling sustainability-related activities and presenting them in a complete report. It is increasingly moving toward disclosure that is more closely connected to business strategy, risk management, operational performance, and financial information, especially under the direction of the IFRS Sustainability Disclosure Standards, which comprise IFRS S1 and IFRS S2 developed by the International Sustainability Standards Board, or ISSB.
IFRS S1 requires organisations to disclose information about sustainability-related risks and opportunities that could affect the entity’s cash flows, access to finance, or cost of capital over the short, medium, and long term. Meanwhile, IFRS S2 focuses on climate-related disclosures, covering governance, strategy, risk management, as well as metrics and targets.
In Thailand, the Securities and Exchange Commission has communicated its direction to enhance sustainability-related disclosures by issuers and listed companies in alignment with the ISSB Standards. In the initial phase, the focus will be placed on climate-related information, or climate-first reporting, together with the disclosure of greenhouse gas emissions covering Scope 1 and Scope 2, as well as a more standardised and credible assurance process.
This is why the second half of the year is not too early to start preparing ESG data. In fact, it is the right time to put the data system in place before the reporting season returns.
Common challenges when ESG reporting starts too late
Many organisations are familiar with the same recurring situation when the reporting period begins. ESG data may still be incomplete. Data sources may not be clearly identified. Supporting evidence may not align with the disclosed figures. Data from subsidiaries, suppliers, and internal departments may also arrive in different formats, requiring significant time to organise, validate, and reconcile.
These issues may once have been seen as a normal part of the reporting process. However, under increasingly rigorous disclosure standards, “good enough” data may no longer be enough.
Today, a credible ESG report needs to be able to answer several key questions. Where does the data come from? Who owns the data? How was it calculated? Is there supporting evidence? How does it connect to the organisation’s risks and opportunities? And can the data be traced and reviewed retrospectively?
What should organisations start preparing in the second half of the year?
The first step is to review the ESG data required for this year’s report. This should include data disclosed in previous years, data required by the reporting standards currently used by the organisation, and any new information that may need to be prepared in response to the direction of ISSB, IFRS S1, and IFRS S2.
Organisations should then clearly identify the owner of each data point. This helps clarify which department is responsible for environmental, social, governance, human resources, supply chain, risk, finance, and operational data, and who is accountable for collecting, reviewing, and confirming that data.
An ESG data collection plan or data calendar should also be developed for each relevant department. This should define the reporting timeline, data format, collection method, and required supporting evidence from the beginning of the process. Doing so can help reduce inconsistencies in data formats and prevent the Sustainability team from spending the end of the year correcting data point by point.
Another area that should begin immediately is the review of supporting evidence for ESG disclosures, particularly for key quantitative indicators such as energy consumption, water use, waste, occupational accidents, employee training, grievances, human rights, supplier assessments, and greenhouse gas emissions.
For climate-related data, organisations should prepare Scope 1 and Scope 2 information with greater readiness, including organisational boundaries, calculation methodologies, emission factors, supporting documents, and assurance processes. At the same time, organisations should begin developing a system for Scope 3 data, which relates to the value chain and supplier information, as this type of data requires time to request, collect, verify, and align across relevant parties.
Finally, internal review should take place before year-end, not only when the report is close to completion. This process should involve Sustainability, Finance, Risk, Operations, Procurement, Human Resources, Investor Relations, and senior management. ESG data should not be treated merely as information for reporting, but as information that reflects how the organisation is being managed in practice.
ESG reporting should not be the responsibility of the Sustainability team alone
The key to ESG reporting in this new era is shifting from “report production” to the development of an organisational data system.
Sustainability-related information involves many functions, from corporate strategy, risk management, costs, procurement, resource use, employee management, supplier management, and corporate governance to potential financial implications in the future.
The IFRS Sustainability Disclosure Standards emphasise information that is useful to investors and users of general purpose financial reports. The focus is on disclosures that help users understand how sustainability-related risks and opportunities may affect the prospects of the organisation. Therefore, organisations that want to strengthen their ESG reporting should begin by strengthening their internal data system, rather than waiting until the reporting period to start collecting information.
A good ESG report is not the most beautiful report, but the most credible one
As ESG standards become more rigorous, a good report is not necessarily the one with the most beautiful design or the highest number of pages. It is the report that is supported by reliable data, clearly traceable sources, reviewable evidence, and a genuine reflection of how the organisation is systematically driving sustainability.
When organisations start preparing data in the second half of the year, the outcome is not only a report that can be completed on time. It is also a more structured working process, stronger collaboration across departments, and ESG data that is ready for reporting, assessment, and long-term strategic decision-making.
Because good ESG reporting should not begin when everything becomes urgent. It should begin while the organisation still has enough time to build a data system that is accurate, complete, and credible.
How many disclosure channels are needed for an ESG report to achieve a good score?
How to prepare one ESG dataset for different disclosure channels, effectively.
Many organisations spend an entire year developing ESG policies, collecting performance data, and preparing comprehensive sustainability reports. Yet, when ESG assessment results are released, many are surprised to find that their scores do not fully reflect the work they have actually undertaken.
One of the questions we are most frequently asked is:
“Is having an ESG Report alone enough?”
The answer is not necessarily.
While FTSE Russell does not prescribe the number of disclosure channels a company must use, it places significant emphasis on Public Disclosure. In other words, sustainability information should be publicly available, easy to access, credible, verifiable, and presented consistently across all disclosure channels.
This means that achieving a strong ESG score is not simply about producing an excellent report. It is about ensuring that the same ESG information is disclosed strategically through the appropriate channels for different stakeholder groups.
One ESG Dataset, Four Disclosure Channels
In practice, Thai listed companies should prepare a single ESG dataset that is suitable for disclosure across four key channels. Although the underlying information remains the same, each channel serves a different purpose and addresses a different audience.
56-1 One Report
Prepared in accordance with the requirements of the Thai Securities and Exchange Commission (SEC). It provides investors with an integrated view of the organisation, covering business performance, financial information, corporate governance, risk management, and sustainability. Rather than presenting ESG as a standalone topic, the One Report demonstrates how sustainability is embedded within the company’s strategy and long-term value creation.
ESG Report or Sustainability Report
Provides a more comprehensive account of the organisation’s sustainability performance. This report allows companies to communicate environmental, social and governance initiatives in greater depth, including long-term commitments, ESG targets, key performance indicators, historical performance trends, and case studies that demonstrate measurable outcomes.
ESG Data Platform
A centralised system used to collect, manage, analyse and report ESG information in a structured format. The platform supports disclosure requirements forregulators, global ESG assessment organisations, investors and other capital market participants. Rather than simply acting as a reporting tool, it enables organisations to maintain consistent, traceable and assessment-ready ESG data across multiple reporting frameworks.
ESG Website
Arguably one of the most important disclosure channels today. An ESG website should no longer function merely as a repository for downloadable PDF reports. Instead, it should serve as a dedicated ESG Information Hub, presenting sustainability strategies, governance structures, climate commitments, performance data, policies, reports, news updates and supporting documents in a clear and intuitive structure. Well-designed navigation and direct links to policies and evidence allow investors, assessors and other stakeholders to locate relevant information quickly and efficiently.
Although these four channels are built upon exactly the same ESG dataset, they serve different purposes and audiences. Organisations should therefore avoid simply duplicating the same content across every platform. Instead, information should be tailored appropriately for each disclosure channel while remaining accurate, consistent and fully aligned.
ESG Disclosure Is No Longer a Year-End Exercise
Another area that many organisations underestimate is the disclosure timeline.
ESG disclosure is no longer an activity that begins once the sustainability report is ready. Instead, it is a year-round process that requires careful planning and coordination.
January and February
Organisations should begin collecting ESG information across all business functions, reviewing data completeness, and preparing content for the 56-1 One Report, Sustainability Report and other disclosure channels. This early preparation also helps ensure that reports can be finalised and published according to the annual reporting schedule.
March and April
Companies should complete and validate information within the ESG Data Platform, ensuring that all data has been reviewed and approved by management before submission.
Early May
Organisations should publish ESG information on their corporate website and submit their application for the FTSE Russell ESG Scores assessment.
June and September
FTSE Russell conducts its assessment using publicly available information. Companies are then typically given an opportunity to review preliminary results and provide additional supporting evidence during September and October, before the final ESG Scores are announced in December.
Viewed as a whole, ESG disclosure is no longer a one-off reporting exercise. It is a continuous process that requires organisations to manage information systematically throughout the year.
Every Piece of ESG Information Deserves to Be Seen
Producing a high quality ESG Report remains an essential foundation. However, the real challenge today is no longer collecting data, it is ensuring that the right information is disclosed through the right channels, at the right time, and in a format that is easy to find, understand and verify.
Organisations that perform well are not necessarily those producing the longest reports, but those that manage their ESG Disclosure Strategy effectively. From data collection and evidence management to disclosure through the 56-1 One Report, ESG Report, ESG Data Platform, and ESG Website, every stage contributes to how investors and ESG assessors perceive an organisation’s sustainability performance.
Ultimately, effective disclosure is about making every ESG effort visible, credible and valuable.
Because in today’s capital market,
The Right Disclosure. Makes Every ESG Effort Count.
ESG Report 2026: No Longer Just a Report, But a Test of Readiness
ESG reporting for Thai listed companies is entering a major transition. What used to be seen as a sustainability disclosure exercise is now becoming a board-level agenda that reflects how well a company manages risk, governance, data quality, and long-term value creation.
With the adoption of ISSB Standards, including IFRS S1 and IFRS S2, ESG Reports will need to go beyond describing sustainability activities. Companies will be expected to explain how sustainability-related risks and opportunities affect their business, how these issues are governed, how risks are managed, and which metrics and targets are used to track performance.
This shift also connects directly with the increasing importance of FTSE Russell ESG Scores, investor expectations, climate-related disclosures, and the quality of information disclosed through the 56-1 One Report, Sustainability Report, and ESG Website.
What Is Changing in ESG Reporting?
Under IFRS S1, companies are required to disclose material sustainability-related financial information, including ESG risks and opportunities that may affect cash flows, access to capital, and enterprise value.
IFRS S2 focuses specifically on climate-related disclosures. This includes climate risks and opportunities, physical risks, transition risks, and greenhouse gas emissions across Scope 1, Scope 2, and Scope 3.
In Thailand, the first phase of implementation will follow a “climate-first” approach. This means companies should begin by strengthening climate-related data, greenhouse gas emissions data, governance structures, risk management processes, and disclosure controls.
In practice, a strong ESG Report will no longer be judged only by how well it is written. It will be judged by how credible, traceable, and decision-useful the information is.
Key Timeline for Thai Listed Companies
The implementation of the FTSE Russell indicators
2025 reporting year / 2026 report discloses
Sustainable and Responsible Investing Funds, or SRI Funds, will be required to disclose information under the new SRI Fund criteria. These requirements aim to enhance transparency, reduce greenwashing risks, and help investors compare sustainability performance more clearly.
2027 reporting year / 2028 report discloses
The requirements will begin to apply to companies in the SET50.
2028 reporting year / 2029 report discloses
The requirements will be expanded to companies in the SET100.
2029 reporting year / 2030 report discloses
The requirements will apply to all listed companies on the Stock Exchange of Thailand, including companies preparing for IPOs.
2030 reporting year / 2031 report discloses
The requirements will apply to companies listed on the Market for Alternative Investment, or mai, as well as REITs, Infrastructure Trusts, Property Funds, and Infrastructure Funds.
This timeline gives companies time to prepare, but it should not create a false sense of comfort. ESG data, especially climate-related data and greenhouse gas emissions data, cannot be built properly at the end of the reporting year. Companies need systems, data owners, internal controls, and evidence trails in place early.
Three ESG Reporting Priorities Companies Should Start Now
1. Prepare Climate-related Disclosures
Companies should begin preparing information on climate-related risks and opportunities, including Scope 1 and Scope 2 greenhouse gas emissions.
Scope 1 covers direct emissions from company-controlled sources. Scope 2 covers indirect emissions from purchased energy. These data points require reliable calculation methods, clear data sources, supporting evidence, and, in many cases, readiness for external verification.
2. Manage ESG Data Across the Value Chain
Although early implementation in Thailand will focus mainly on Scope 1 and Scope 2 emissions, companies should also start preparing for Scope 3 disclosure.
Scope 3 covers greenhouse gas emissions across the value chain, including upstream and downstream activities. This may involve suppliers, contractors, logistics providers, distributors, and product use by customers.
The challenge is that much of this information does not sit within the company. Companies should therefore begin engaging key suppliers, mapping value chain data, and building practical data collection processes as early as possible.
3. Strengthen Sustainability Governance and Risk Management
Under the new ESG reporting requirements, companies must clearly disclose how sustainability and climate-related issues are governed.
This includes the roles of the board, executives, committees, and working teams. Companies must also show how ESG risks are assessed, managed, and connected to business strategy.
IFRS S1 and IFRS S2 follow four core disclosure pillars:
Governance
Strategy
Risk Management
Metrics & Targets
This means ESG reporting is no longer the sole responsibility of the Sustainability team. It requires collaboration across risk management, finance, accounting, operations, procurement, human resources, legal, marketing, and the board of directors.
What Companies Should Do Today
To prepare for ESG Report 2026 and upcoming ISSB-based disclosure requirements, companies should begin with the following actions:
Map new ESG reporting requirements against existing internal data.
Assign clear data owners for each ESG and climate-related data point.
Organise Scope 1 and Scope 2 greenhouse gas emissions data for verification.
Start planning Scope 3 data collection with key suppliers and business partners.
Connect ESG issues with enterprise risk management and business strategy.
Align disclosure content across the 56-1 One Report, Sustainability Report, ESG Website, and FTSE Russell ESG Score requirements.
Build internal readiness among the people responsible for ESG data, governance, and disclosure.
From Compliance to Business Readiness
The new ESG reporting requirements may appear to be another compliance burden. However, they also create an important opportunity for companies to strengthen risk management, improve data quality, build investor confidence, and prepare for future expectations from regulators, capital markets, and global sustainability standards.
A strong ESG Report is no longer just a communication document. It is evidence of business readiness.
For Thai listed companies, ESG reporting in 2026 and beyond will be about more than disclosure. It will be about whether the organisation has the governance, systems, data, and accountability needed to manage sustainability risks and opportunities in a credible and future-ready way.
References
Stock Exchange of Thailand, summary of Thailand’s sustainability disclosure requirements in alignment with ISSB Standards, including the phased implementation timeline for SET50, SET100, SET-listed companies, mai-listed companies, trusts, and related funds. https://setsustainability.com/page/disclosure
Securities and Exchange Commission, Thailand, announcement on revised SRI Fund disclosure criteria to strengthen transparency, reduce greenwashing risks, and improve sustainability-related fund disclosure. https://www.sec.or.th/TH/Pages/News_Detail.aspx?SECID=12343
Working on ESG All Year But Still Not Getting the FTSE Russell Score You Deserve?
Let’s Fix That: Build a Simple Data System That Actually Gets You Points
Your ESG Score Didn’t Meet Your Goal—Even Though You Did the Work
You’ve been running ESG programs all year. You have sustainability policies in place. But your FTSE Russell ESG score still isn’t where you want it to be. Sound familiar? Here’s the good news: you’re probably doing more than you think. The issue isn’t the work itself—it’s how you’re organizing and showing that work. This year, let’s change that by setting up a straightforward data system that helps evaluators see what you’re actually doing.
Introduction
Many organizations have received their FTSE Russell ESG Rating scores, which were released in December 2025. Congratulations to those who achieved their target scores. For organizations that fell short, you might feel disappointed and wonder, “Why didn’t our score improve as expected when we’ve implemented so many ESG initiatives?” The answer isn’t about doing too much or too little work—it’s about having systematic data collection, documentation and evidence management, and disclosure practices that allow assessors to properly evaluate and score your efforts. This article provides an actionable roadmap to help you establish an ESG data management system throughout the year, enabling you to systematically elevate your scores with principles that support long-term sustainable operations.
Understanding FTSE Russell ESG Rating Assessment Principles
FTSE Russell assesses ESG based on verifiable data and disclosures with a clear audit trail for data sources. Publicly listed companies are evaluated annually, with the assessment cycle typically running from June through March of the following year. Scores become available approximately four weeks after the Index Review in June, with official results announced in December.
A critical part of the process is the Company Review Period, when companies can provide additional information. This is an essential opportunity for companies to clarify data and address questions from FTSE Russell, which can result in higher scores. Here’s a summary of what you need to ensure to earn.
5 Main Reasons Your Score Isn’t Improving Despite Additional Work
Based on experience working with multiple organizations, here are five commonly encountered issues:
1. Scattered Data with No Clear Data Owner or Job Owner
ESG data often resides across different teams and files, using inconsistent definitions. When compiling data for reporting, this frequently leads to inconsistencies or overlapping data that’s difficult to explain and utilize effectively.
2. Evidence Isn’t Public or Can’t Be Found
Even when organizations genuinely implement initiatives, if evidence isn’t publicly disclosed or easily searchable, assessors cannot award points. This causes organizations to miss out on well-deserved scores.
3. Irregular Data Collection Cycles
The “compile everything at year-end” approach often results in missing critical data or misalignment with assessment cycles. Year-end data collection not only risks incomplete data but also creates significant headaches for the team.
4. Policies Without Measurement, Plans Without Results
Since FTSE Russell assesses both “structure” and “outcomes,” having only policies without KPIs, or only numbers without governance frameworks, leads assessors to view the data as lacking foundation, resulting in incomplete scoring.
5. No Quality Assurance/Quality Control (QA/QC)
Organizations that change policies, plans, and definitions every quarter show no continuity in their initiatives. When current year data can’t be compared with previous years, the credibility of the program diminishes.
Change your perspective and make your ESG program “scorable,” not just “doable.” The key principle to understand is that scores don’t come from good intentions but from “provable systems.” Therefore, establishing an effective ESG data management system is more important than conducting numerous ESG activities without systematic documentation.
Organizing ESG Data Collection in 5 Steps
If you don’t know where to start, try following these steps to establish a data management system and elevate your ESG reporting scores:
1. Analyze Scores and Gaps
Clearly identify “where points were lost” and “what should be improved first.” Review the latest assessment results broken down by Pillar (Environmental, Social, Governance) and prioritize data based on score concentration. This will reveal your “priority fix list” to identify what’s urgent and should be addressed first. Don’t forget to include the names of responsible parties, reviewers, and approvers for each topic to plan subsequent work.
2. Create an ESG Data Management System
Establish consistent data collection that allows year-round comparison. Develop a data framework that typically includes definitions for each indicator, collection methods, units of measurement, data collection scope, base year, and data sources. Develop tools or methods to track ESG work and data covering all indicators, data collection status, responsible parties, and supporting evidence or reference documents. Remember to align data collection cycles with annual assessment schedules.
3. Prepare Evidence and Reference Documents for Public Disclosure
Make evidence and reference data easily searchable, verifiable, and public. Create standardized datasets for organization-wide communication and collaboration, including policies, operational procedures, and KPI definitions, so the entire organization shares the same vision and moves toward common goals.
4. Design Disclosure Strategy
Ensure disclosed information is clear, relevant to the criteria, and matches FTSE Russell keywords. Structure your reports and ESG website pages for easy searching with clear categories and convenient access. Content should cover governance, policies and practices, goals and indicators, program progress, and verifiable reference evidence.
5. Test Run and Prepare for Assessment
Reduce risks before entering the actual assessment process. In this step, verify consistency between outcome figures, actual programs, disclosed reports, and reference documentation to ensure all data sets align. Assessors may have questions and follow-ups. At this juncture, readiness to respond quickly with supporting evidence is crucial to ensure your report doesn’t miss deserved points.
Quick Start Checklist
If you want to start immediately, here are 8 steps to take first:
Assign data owners for each ESG topic – Designate clear responsibility for each area (E, S, G)
Create a one-page summary showing where score gaps exist, starting with key indicators that most impact scores
Build an ESG data tracking sheet – Use Google Sheets or Excel, but it must be accessible to everyone
Create a folder for reference documents, supporting evidence, and related data with systematic structure for easy searching
Set clear data collection cycles – Monthly or quarterly depending on work nature and data type, add to calendar and notify all stakeholders
Summarize high-impact topics – Review the big picture and prioritize
Create an ESG Hub Page on your website – Even a simple page is better than nothing
Establish mandatory data review before any external submission or publication
Improve Your ESG Reporting Score with “Systems”, Not “More Work”
If your FTSE Russell ESG Rating score didn’t meet targets last year, this year is a golden opportunity to reset your approach. The critical shift is moving from year-end fire-drill ESG projects to creating a repeatable, continuous ESG management system that operates reliably year-round. When you have a solid system for data collection, evidence management, and disclosure, you’ll achieve:
Easier workflow for your team
Greater data credibility
Assessors able to score according to actual performance
More effective ESG communication for your organization
Are You Ready to Get Started?
If your organization needs additional consultation on establishing an ESG Data Management system or wants a customized FTSE Russell ESG Readiness Checklist designed specifically for your organization, don’t hesitate to contact us for further guidance.
5 key differences of SET ESG Ratings and FTSE Russell ESG Scores
Why FTSE Russell Matters for Thai Companies
ESG is no longer just about “responsibility”—it has evolved into an “investment standard” that drives global investor decision-making. The Stock Exchange of Thailand’s transition from SET ESG Ratings to FTSE Russell ESG Scores represents far more than a procedural change. It’s a pivotal shift that every listed company must understand and prepare for strategically.
FTSE Russell stands as a globally recognized ESG index and risk assessment provider, operating across over 80 countries worldwide and evaluating more than 85,000 companies throughout Europe, the Americas, and Asia. Its core strength lies in relying exclusively on publicly disclosed information, ensuring transparency, comparability, and verifiable assessment standards that meet international benchmarks.
To help Thai listed companies navigate this transition effectively and leverage this opportunity to elevate their organizational sustainability, this article examines the 5 fundamental differences between SET ESG Ratings and FTSE Russell ESG Scores. We’ll explore the transition roadmap you need to understand and provide systematic preparation strategies for your organization.
Figure 1FTSE Russell ESG Scores Model
The 5 key differences Thai ESG Ratings/Scores
1. Scoring Systems and Performance Disclosure
One of the most significant distinctions between SET ESG Ratings and FTSE Russell ESG Scores lies in their “scoring methodology” and “public disclosure” of results—a paradigm shift that fundamentally impacts corporate reputation, transparency, and investor confidence.
Under SET ESG Ratings, companies receive tier-based ratings (BBB, A, AA, or AAA) only when they meet minimum qualifying thresholds. Beyond achieving scores above 50% across each dimension (Environmental, Social, Governance), companies must satisfy additional requirements such as maintaining a CGR rating of at least 3 stars and demonstrating no negative governance issues during the assessment period. Companies failing to meet these criteria receive no public rating disclosure whatsoever.
FTSE Russell ESG Scores takes the opposite approach, implementing unconditional disclosure of all company scores using a decimal-based system ranging from 0.0 to 5.0. Regardless of performance level, all scores will be publicly announced starting in 2026, providing open access to investors and the general public.
While detailed insights such as thematic scores, dimensional breakdowns, or individual indicator performance remain accessible only within FTSE Russell’s proprietary system using company-specific access codes, the overall score—representing your organization’s “ESG identity” on the global stage—becomes universally visible. Whether you achieve a 4.8 or 0.9, the result is transparent to all stakeholders.
This transparency extends beyond mere openness to directly impact corporate “credibility.” Low scores without adequate explanation or appropriate disclosure may lead investors to conclude that the organization lacks genuine ESG commitment or systematic sustainability management practices.
This difference transcends scoring methodology—it represents a fundamental shift from “seeking assessment” to “communicating transparency” continuously through verifiable, publicly disclosed information.
In an era of heightened investor focus on ESG factors, companies that strategically manage their disclosure practices will not only achieve scores reflecting their true potential but also earn sustainable “stakeholder confidence.”
Summary
SET ESG Ratings
Scores only companies that “meet qualifying thresholds”
Announces results in tier format: BBB, A, AA, AAA
FTSE Russell ESG Scores
Scores all companies regardless of performance level
Uses decimal scoring format: 0.0–5.0
Publicly announces overall scores starting in 2026
Detailed insights (thematic scores, dimensions, indicators) accessible only through company-specific system access
The Advantage
FTSE Russell operates on principles of “transparency and equality”—every company has the opportunity to communicate ESG progress, not just those meeting minimum thresholds.
2. ESG Data Collection Methodology
Another game-changing distinction lies in the approach to ESG data collection. SET ESG Ratings requires companies to voluntarily register and complete comprehensive questionnaires with extensive supporting documentation from both public sources and internal records for Stock Exchange evaluation.
FTSE Russell ESG Scores eliminates questionnaires entirely, instead evaluating companies based solely on “publicly disclosed information”—sustainability reports, annual reports, Form 56-1 One Reports, and corporate websites. No internal documentation receives consideration.
This philosophy reflects international capital market principles emphasizing the ability to “communicate sustainability” directly, clearly, and accessibly. Companies capable of systematically disclosing ESG information can confidently navigate assessments without dedicating time and resources to hundreds of questionnaire responses.
Simultaneously, this signals that ESG disclosure should not be limited to assessment seasons but should represent “continuous public transparency”—robust, evidence-backed, and consistently verifiable information.
Summary
SET ESG Ratings
Companies must register and complete assessment forms
Requires internal documentation such as undisclosed policies and reports
FTSE Russell ESG Scores
No registration or form completion required—all listed companies assessed automatically
Uses exclusively publicly disclosed information:
Sustainability Reports
Annual Reports
Form 56-1 One Reports
Official corporate websites
The Advantage
Companies avoid duplicative work while establishing “comprehensive disclosure systems” that are accurate, complete, and easily accessible—benefiting investors and all stakeholders alike.
3. Review Process and Supplementary Information
FTSE Russell recognizes that assessments based solely on public disclosure may contain gaps, therefore designing a process enabling companies to review and provide additional information before final results are announced. Companies receive email notifications from FTSE4GOOD approximately September through October each year to access the FTSE Russell Platform and review their preliminary results.
Within this system, companies can provide commentary, submit additional reference documents, or clarify information not yet reflected in public sources. Organizations have approximately one full month to complete this process—a critically important window of opportunity. Once the deadline passes, FTSE Russell closes the system, accepts no additional information, and proceeds to finalize scores officially, announcing results in December of the same year.
This period represents a golden opportunity for companies to provide context, supplement missing information, or correct misunderstandings before final scores are transparently published to global investors and stakeholders. Importantly, these scores remain unchanged until the following year’s assessment cycle.
Companies missing this window—whether due to outdated contact information preventing notification receipt or lack of system response—must accept scores based solely on available information. In cases of low scores, this can immediately impact reputation and investor confidence on the international stage.
FTSE Russell provides companies the opportunity to
Review preliminary results and provide feedback within the system
Timeframe: September–October annually
Duration: Approximately one month
Method: Email notifications sent to designated company contacts
Companies can use this period to:
Verify information accuracy
Provide supplementary information or correct discrepancies
Update contact details to avoid missing notifications
Upon deadline expiration, FTSE Russell finalizes and announces scores in December.
4. Business Grouping and Industry Classification Systems
An accurate ESG assessment cannot apply uniform criteria across all businesses, as risks and material issues vary distinctly by industry. Business classification represents another critical difference between SET ESG Ratings and FTSE Russell ESG Scores.
Business Grouping and Industry Classification of SET ESG Ratings
It employs the Stock Exchange of Thailand’s classification structure, dividing companies into 8 major industry groups:
Agribusiness & Food
Consumer Products
Financials
Industrials
Property & Construction
Resources
Services
Technology
Each group subdivides into 28 business sectors for assessment and comparison of similar companies—such as banking, energy, food & beverage, communications, etc. While suitable for Thai capital market management, this system has limitations in granularity and alignment with global ESG standards. Despite effectively reflecting the Thai market overview, it cannot achieve the depth of segmentation or international benchmarking required for sophisticated analysis.
Business Grouping and Industry Classification of FTSE Russell ESG Scores
It utilizes the ICB (Industry Classification Benchmark)—a globally recognized industry classification system used by investors and stock exchanges across over 80 countries, enabling accurate and fair cross-sector, cross-border company comparisons.
ICB divides industries into 11 primary groups:
Oil, Gas and Coal – Traditional energy businesses including oil, natural gas, coal
Basic Materials – Raw materials and mining including metals, chemicals, plastics, paper
Industrials – Machinery, heavy industry, engineering, general manufacturing
Consumer Discretionary – Non-essential goods and services including automotive, apparel, furniture, entertainment
Financials – Banking, insurance, funds, and various financial services
Real Estate – Property development, asset management for residential, commercial, or industrial properties
Technology – Software, hardware, electronics, telecommunications, IT services
Telecommunications – Telephone networks, internet, satellite, and other communication services
Utilities – Public utilities including electricity, water, gas, and renewable energy
ICB extends beyond primary industry groups, subdividing into 20 Supersectors, 45 Sectors, and ultimately 173 Subsectors at the most granular level. This enables FTSE Russell assessments to identify ESG issues material to each specific business type with precision.
For example, a property development company operating in Thailand might be classified under “Real Estate Development,” which has entirely different indicators from “Real Estate Investment Trusts (REITs)” or “Construction & Engineering,” despite all falling under the broader real estate category.
Furthermore, FTSE Russell considers the operational country context. Companies based in developing countries may need greater emphasis on human rights or anti-corruption measures rather than carbon issues in certain cases. The system analyzes “materiality levels” for each ESG theme, then weights indicators appropriately for that specific business. This represents “Context-Based ESG Scoring”—emerging as the new global standard.
Summary
SET ESG Ratings
Uses Thai Stock Exchange criteria
Divides into 8 industry groups / 28 business sectors
FTSE Russell ESG Scores
Uses ICB – Industry Classification Benchmark
International standard used across 80+ countries
Divides into 11 primary industry groups with detailed segmentation to 173 subsectors
Considers “primary revenue sources” identified in financial statements and One Reports
Multi-business companies may span multiple subsectors
Considers “operational country context” concurrently
Strength
FTSE Russell assesses based on “actual business risks” and country context, delivering accurate and internationally relevant ESG profiles.
5. Indicator Quantity and Complexity Levels
While both SET ESG Ratings and FTSE Russell ESG Scores measure from similar core dimensions—Environmental (E), Social (S), and Governance (G)—the clear distinction lies in the depth, specificity, and structural design of FTSE Russell’s indicator framework.
SET ESG Ratings employs approximately 140-150 indicators, predominantly general metrics applied universally across all industries, with only minimal adjustments for specific business characteristics.
FTSE Russell ESG Scores utilizes a more comprehensive and flexible indicator set, comprising over 300 indicators divided into two categories:
Universal indicators representing approximately 56%
Sector- and Country-specific indicators comprise the remaining 44%, which vary according to industry characteristics and the operational context of each country.
Each company is not assessed against all 300+ indicators simultaneously, but rather evaluated on what is “genuinely material,” averaging approximately 125 indicators per company. This reduces reporting burden while enabling scores to more precisely reflect organizational capabilities.
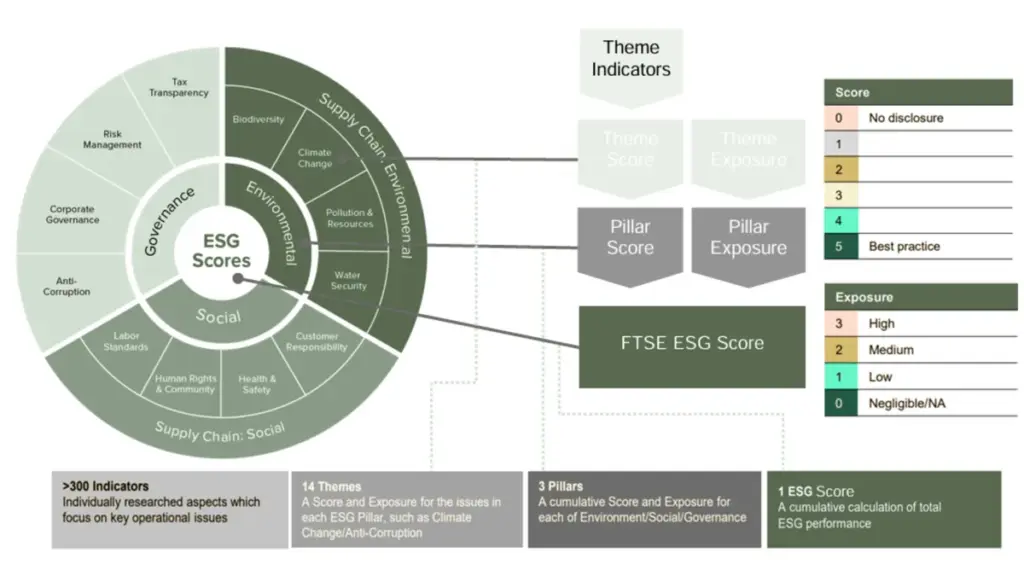
All FTSE Russell ESG Scores indicators are categorized under 14 ESG Themes linked to systematic global ESG risks, organized across three core dimensions:
Environmental
Biodiversity
Climate Change
Pollution and Resources
Water Security
Supply Chain (Environment)
Social
6. Human Rights and Community
7. Labor Standards
8. Health and Safety
9. Customer Responsibility
Governance
10. Risk Management
11. Tax Transparency
12. Anti-Corruption
13. Corporate Governance
14. Supply Chain (Social)
The distinctive feature of FTSE Russell’s system lies in risk materiality assessment for each theme across industries, categorized into four levels:
High (Very high risk)
Medium (Moderate risk)
Low (Low risk)
Not Relevant (Not applicable)
When any theme receives a “Not Relevant” (N/A) assessment for a specific business, the company will not be evaluated on that theme, and it will have zero impact on overall ESG score calculations.
For example, if a company operates in digital services, “Water Security” might be classified as Not Relevant due to minimal water usage in operations. Conversely, for mining or agricultural businesses, this theme might receive a High classification, requiring serious management and disclosure commitments.
Additionally, certain indicators maintain heightened intensity requirements, such as three-year historical data disclosure, external verification, or demonstrable impact measurement rather than mere policy statements or commitments.
This comprehensive approach means FTSE Russell ESG Scores evaluate not just “what organizations have” but rather “how organizations manage risk and create transparency” in matters most material to their specific context.
Summary
SET ESG Ratings
Approximately 140-150 indicators
Predominantly general metrics
FTSE Russell ESG Scores
Over 300 indicators
Divided into:
56% universal indicators
44% specific indicators (industry + country-specific)
Certain indicators maintain high intensity requirements:
Three-year historical data disclosure
External verification requirements
Recommendation
Companies should systematically study FTSE indicators to strategically plan comprehensive disclosure aligned with their specific context.
Figure 2FTSE Russell ESG Scores Data structure
Timeline for FTSE Russell ESG Scores Transition
Year
Development
2024
Leading listed companies begin pilot FTSE Russell assessments
2025
Companies may “voluntarily” request assessments
2026
FTSE Russell ESG Scores fully operational, officially replacing SET ESG Ratings
Preparation Strategies for FTSE Russell ESG Scores
1. Develop Transparent ESG Data Architecture
As Thailand’s ESG assessment system transitions from questionnaire-based evaluation to comprehensive public disclosure assessment, companies preparing for FTSE Russell ESG Scores must establish not only clear ESG policies but also “disclosure systems” that are transparent, systematic, and accessible beyond previous requirements.
Preparation extends beyond content to encompass processes, mindset, and continuity of information that organizations choose to communicate publicly through published documents, website-hosted reports, and internal systems supporting consistent disclosure practices.
2. Enhance Website Disclosure Systems
Corporate websites, typically the first point of reference, require structured ESG or IR (Investor Relations) menu organization with current information and comprehensive linkage to critical documents such as Sustainability Reports, ESG Policies, GHG Emissions data, and organizational values. This prevents assessor confusion or misinterpretation from fragmented information.
3. Verify Three-Year Historical Data
FTSE Russell considers three-year historical data across multiple indicators, particularly for trend analysis such as carbon reduction or female executive representation. Companies should ensure quantitative evidence (KPIs and performance data) is maintained consistently and consider external verification (auditor or verifier certification) for certain data points to enhance disclosure credibility.
4. Update Company Contact Information
This seemingly minor detail often causes organizations to miss critical opportunities, especially approaching annual assessment periods. Organizations not receiving FTSE4GOOD email notifications during September-October will forfeit opportunities to review preliminary results or submit additional system information, potentially resulting in December score announcements that fail to reflect current company data.
The Transition as Strategic Opportunity (Not to Be Overlooked)
FTSE Russell ESG Scores represents more than a “new assessment system”—it’s a powerful opportunity to elevate Thai organizations’ internal management capabilities and genuinely open doors to the global ESG stage.
Many perceive ESG disclosure as burdensome—filled with reports, indicator tables, and management obligations. In reality, organizations beginning with proper system establishment from the outset discover it’s not only manageable but becomes a process enabling profound organizational self-examination in previously unconsidered dimensions.
Data previously scattered across departments, explanations once limited to “internal use,” and problems whose “root causes remained unknown” gradually emerge clearly as you systematize, create disclosure frameworks, and communicate authentically.
This represents an organizational “transformation” period—not for assessment compliance but for identifying inefficiencies, financial leakages, or hidden risks, and areas deserving reinforcement because they create long-term business and sustainability value.
Early-adopting companies gain advantages beyond scoring—they achieve “self-awareness and understanding.” When you know your global positioning, you advance with greater confidence than others.
In the ESG landscape, transparency isn’t a burden but a tool for building credibility and strategic advantage, plus organizational self-understanding—all beginning with strategic and intentional “disclosure.”
A guide to understanding the FTSE Russell ESG Scores for corporate leaders
What is FTSE Russell ESG Scores
FTSE Russell is a framework designed for worldwide companies to evaluate their performances in three pillars; Environmental, Social, and Governance. In collaboration with the Stock Exchange of Thailand (SET) and the London Stock Exchange Group (LSEG) launched a comprehensive assessment framework for benchmarking, analytics, and data solutions for investors. The purpose of this framework is increasingly significant for publicly listed companies as investors progressively incorporate sustainability factors into their investment decisions.
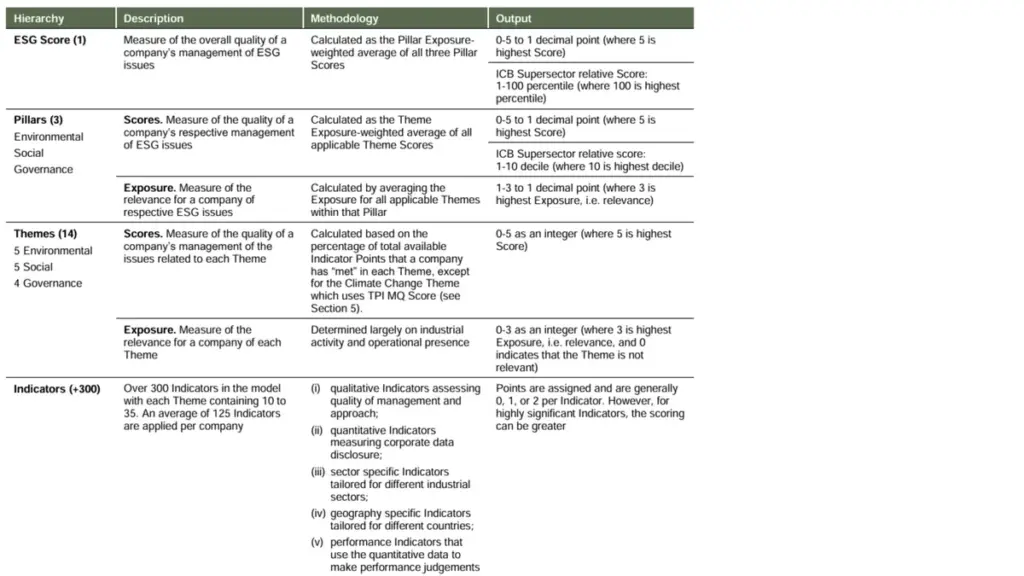
The Explanation of FTSE Russell ESG Scores
The FTSE Russell ESG Rating methodology assesses companies across 14 ESG themes containing over 300 individual indicators. They are divided into (1) general indicators and (2) industry group indicators, with each listed company being assessed on average around 125 indicators, with the FTSE Russell indicators giving approximately 56% weight to general questions and 44% to questions that delve deeper into sectors and countries.
These themes are categorized into three pillars: Environmental, Social, and Governance.
The Environmental pillar examines how companies manage their impact on the natural world, focusing on climate change strategies, water security measures, biodiversity protection efforts, and pollution control systems. Companies are evaluated on their policies, programs, targets, and actual performance in reducing their environmental footprint.
The Social pillar assesses how organizations interact with employees, customers, suppliers, and their communities. This includes labor standards and working conditions, human rights policies and community engagement, health and safety protocols, and customer responsibility practices such as product safety and data protection.
In the Governance pillar, FTSE Russell examines corporate structures and processes that ensure proper oversight, accountability, and ethical business conduct. Key areas include board composition and effectiveness, anti-corruption measures, tax transparency, and comprehensive risk management frameworks.
Companies are evaluated on both their exposure to ESG risks (determined by their industry and geographic operations) and the quality of their management response to these risks. This creates a balanced assessment that recognizes both inherent operational challenges and management effectiveness. For example, an oil company may have high environmental risk exposure but could still score well if it demonstrates exceptional management of those risks relative to industry peers.
SET ESG Rating vs. FTSE Russell ESG Scores: Key Differences
The Stock Exchange of Thailand (SET) ESG rating system and FTSE Russell’s framework share similar objectives but differ in several important aspects.
In terms of geographic focus, SET ESG is explicitly designed for the Thai market and business environment, whereas FTSE Russell applies global standards that enable international comparability. This distinction is crucial for companies with international investors or ambitions for global expansion.
The methodology also differs significantly. SET ESG is tailored to the Thai business context, taking into account local regulatory requirements and market conditions. FTSE Russell employs a standardized global methodology that allows for cross-border and cross-industry comparisons, making it particularly valuable for international investment decisions.
The assessment process varies as well. SET ESG typically conducts annual assessments based primarily on company disclosures. FTSE Russell employs continuous assessment with more frequent updates, incorporating a wider range of data sources beyond company reports. This provides a more dynamic and comprehensive view of a company’s ESG performance.
Data sourcing represents another key difference. While SET ESG relies predominantly on company-disclosed information, FTSE Russell supplements this with multiple sources including third-party data, news analysis, and stakeholder reports. This multi-source approach helps validate company claims and provides a more objective assessment.
Thematic coverage also distinguishes the two frameworks. SET ESG focuses on issues particularly relevant to the Thai market and regulatory environment. FTSE Russell covers a comprehensive range of global ESG issues, which may include emerging risks that are not yet prevalent in Thailand but are important to international investors.
Finally, the scoring systems differ in presentation. SET ESG uses a stars-based rating system (1-5 stars), while FTSE Russell employs a numerical scale ranging from 0.0 to 5.0, wherein a score of 0.0 indicates an absence of evaluative information, and a score of 5.0 represents the pinnacle of best practices. The FTSE Russell approach allows for more granular differentiation between companies and clearer tracking of incremental improvements.
The key distinction is that while SET ESG provides valuable insights into the Thai market, FTSE Russell offers a globally recognized benchmark that enables international comparisons and attracts a broader range of global investors.
Opportunities for High-Scoring Companies
Companies that achieve high scores in the FTSE Russell ESG Scores can leverage several significant advantages in today’s sustainability-focused business environment.
Enhanced access to capital represents perhaps the most tangible benefit.
Global investment firms managing trillions in assets use FTSE Russell ESG ratings to screen potential investments. High-scoring companies gain privileged access to ESG-focused investment funds, which have seen record inflows in recent years. They may also secure green bonds and sustainability-linked loans at favorable rates, reducing capital costs. Furthermore, they attract long-term institutional investors who value sustainability as a proxy for management quality and future resilience.
Strong ESG performance also offers substantial competitive differentiation. Companies with high FTSE Russell ratings enjoy improved reputations among stakeholders, which translates into enhanced brand value and customer loyalty, particularly among younger consumers who increasingly make purchasing decisions based on sustainability criteria. This reputation advantage extends to stronger positioning in competitive tenders, particularly for government and corporate contracts that increasingly incorporate ESG requirements.
Risk mitigation and operational efficiency present another valuable opportunity.
The framework encourages risk management practices that lead to reduced exposure to environmental and social risks, which can manifest as costly disruptions, litigation, or regulatory penalties. Companies often experience lower compliance costs through proactive management rather than reactive responses to new requirements. Many sustainability initiatives simultaneously enhance operational efficiency through resource optimization, whether in energy, water, or materials. Additionally, strong ESG performers face a reduced likelihood of regulatory penalties as they typically exceed compliance requirements.
Global recognition and stakeholder trust
High FTSE Russell ratings provide international recognition of sustainability leadership that extends beyond national borders which investors can compare scores with listed companies around the world. This improved credibility with multinational partners and customers who increasingly screen their supply chains for sustainability risks. Strong performers also develop stronger relationships with regulators and policymakers, potentially influencing future policy development. The reputation benefits extend internally as well, enhancing employee and talent attraction and retention in competitive talent markets where purpose-driven organizations have advantages.
Practical Implementation for Thai Companies
For Thai corporate leaders looking to improve their FTSE Russell ESG performance, several strategic approaches can yield significant results.
You better start with gap analysis and strategy development, which represent essential first steps. Companies should comprehensively compare their current sustainability practices against FTSE Russell metrics to identify strengths and weaknesses. This assessment helps identify high-impact improvement areas based on materiality assessment—focusing resources where they will have the greatest effect on both sustainability outcomes and ratings improvement. With this understanding, organizations can develop a comprehensive ESG strategy with clear goals, timelines, and accountability measures that align with both business objectives and FTSE Russell criteria.
Governance structure enhancement often yields substantial rating improvements. This involves ensuring board-level oversight of ESG matters, with clear reporting lines and regular sustainability discussions at the highest organizational level. Companies should establish clear accountability for sustainability performance through designated roles and compensation links. Integrating ESG considerations into risk management frameworks helps identify emerging issues before they become problems and demonstrates a sophisticated management approach to potential investors.
Robust data management and disclosure systems are increasingly critical. Leading companies implement specialized systems to collect, verify, and report ESG data with the same rigor as financial information. Aligning disclosures with international standards such as GRI, SASB, and TCFD ensures compatibility with investor expectations and rating methodologies. Transparency in both successes and challenges builds credibility with raters and investors, who recognize that sustainability transformation is a journey rather than an immediate destination.
Stakeholder engagement complements these technical approaches. Companies should regularly engage with investors to understand their evolving ESG expectations and priorities. Collaboration with industry peers on common sustainability challenges can accelerate progress and demonstrate sector leadership. Participation in relevant sustainability initiatives and platforms increases visibility and provides valuable learning opportunities that can inform internal practices.
In the era of responsibility
The FTSE Russell ESG framework represents more than just a rating system—it offers a roadmap for sustainable business transformation. For Thai corporate leaders, understanding and implementing this framework can drive long-term value creation while meeting the growing expectations of global investors and stakeholders.
By strategically approaching the FTSE Russell assessment, companies can transform sustainability compliance into a competitive advantage, accessing new capital opportunities while building resilience for the future. In an era where sustainable business practices increasingly define market leaders, high FTSE Russell ratings serve as both validation of current excellence and a foundation for continued success in an evolving business landscape.
the Most Renowned ESG Voluntary Frameworks: Dow Jones Sustainability Indices (DJSI)
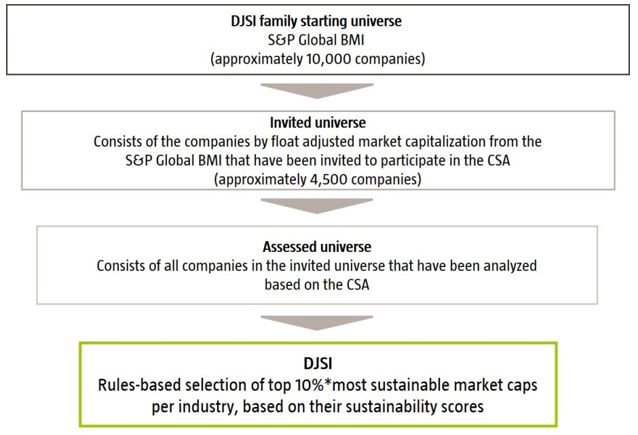
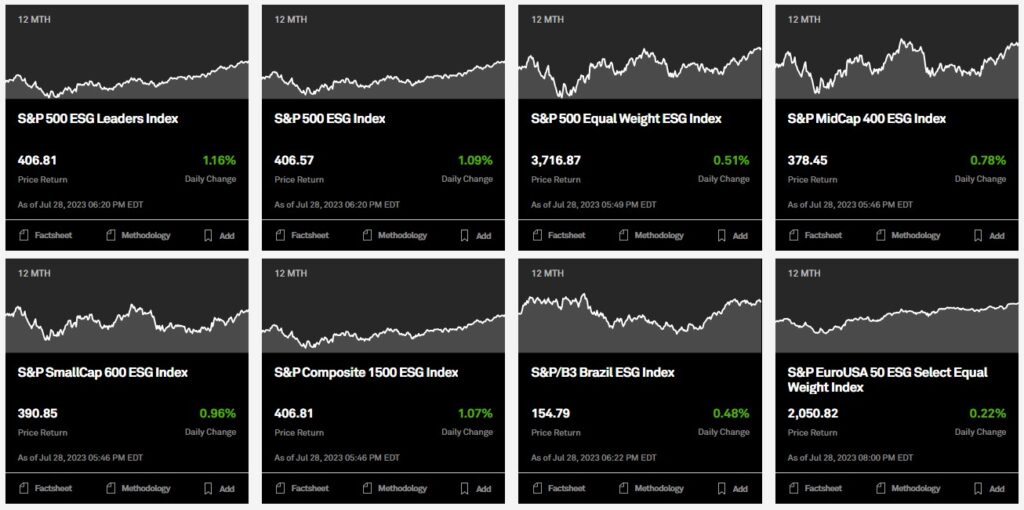
The Dow Jones Sustainability Indices (DJSI) are a family of best-in-class benchmarks for investors who have recognized that sustainable business practices are critical to generating long-term shareholder value and who wish to reflect their sustainability convictions in their investment portfolios. The family was launched in 1999 as the first global sustainability benchmark and tracks the stock performance of the world’s leading companies in terms of economic, environmental and social criteria. Created jointly by S&P Dow Jones Indices and Robeco Sustainable Asset Management (SAM), the DJSI combine the experience of an established index provider with the expertise of a specialist in Sustainable Investing to select the most sustainable companies from across 61 industries. The DJSI World applies a transparent, rules-based component selection process based on the companies’ Total Sustainability Scores resulting from the annual S&P Global Corporate Sustainability Assessment (CSA). Only the top ranked companies within each industry are selected for inclusion in the Dow Jones Sustainability Index family. No industries are excluded from this process as shown in Figure 1.
* Global Indices: Top 10%, Regional Indices: Top 20%, Country Indices: Top 30%
Figure 1
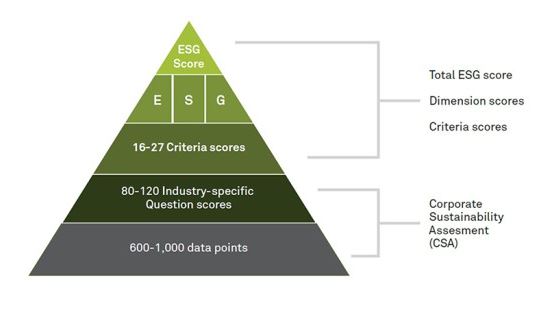
The composition of the DJSI is reviewed each year in September based on the S&P Global ESG Scores resulting from the annual SAM and CSA and is rebalanced quarterly (S&P Global, 1, 2023). The CSA has become the basis for numerous ESG indices over the last two decades. S&P Global acquired the CSA in 2019, which included the transition of the related ESG ratings and ESG benchmarking teams and that now operate out of S&P Global Switzerland. The Corporate Sustainability Assessment (CSA) empowers you to leverage the unique expertise and the proprietary methodology and database underlying the world’s most renowned sustainability indices (S&P Global, 2, 2023). While increasing numbers of companies have chosen to participate in the CSA, annual reviews have enabled the questions to be refined and streamlined over the years. The result is that currently relevant sustainability themes are combined with the systematic introduction of emerging sustainability issues and it can be said that it is the continuing evolution process of the CSA (S&P Global, 3, 2023).Starting April 2019, S&P DJI has begun further leveraging SAM sustainability data to deliver an extensive range of ESG indices. The S&P ESG Index Family, which are sets of indices, offers investors exposure to companies according to their ESG profile in the context of country-specific and regional indices. The index families are based on S&P DJI ESG Scores, based on the results of the annual S&P Global Corporate Sustainability Assessment (CSA). The index family includes broad market indices like the S&P 500 ESG, S&P Europe 350 ESG, S&P Global 1200 ESG, and S&P Japan 500 ESG, designed to closely track their parent indices with similar risk and return profile and low tracking error. The key criteria for constituent eligibility and selection in the S&P ESG Index Family are the S&P DJI ESG Scores. The scores contain a total company-level ESG score for a financial year, comprising individual environmental (E), social (S), and economic & governance (G) dimension scores. The criteria scores are weighted to eliminate biases among different industries and companies that complete the CSA versus companies that are assessed on the basis of publicly available information. The methodology of the S&P ESG Index Family is constructed to be simple, with a selection process meant to keep index’s industry weights in line with S&P broad market indices. The index methodology results in improved composite ESG scores, and offers improved ESG performance across each industry group (S&P Global, 4, 2023). Figure 2 Shows the score of CSA and ESG Indices, and figure 3 shows an example feature of S&P ESG Indices (S&P Global, 5, 2023).
Figure 2
Figure 3
CSA Methodology
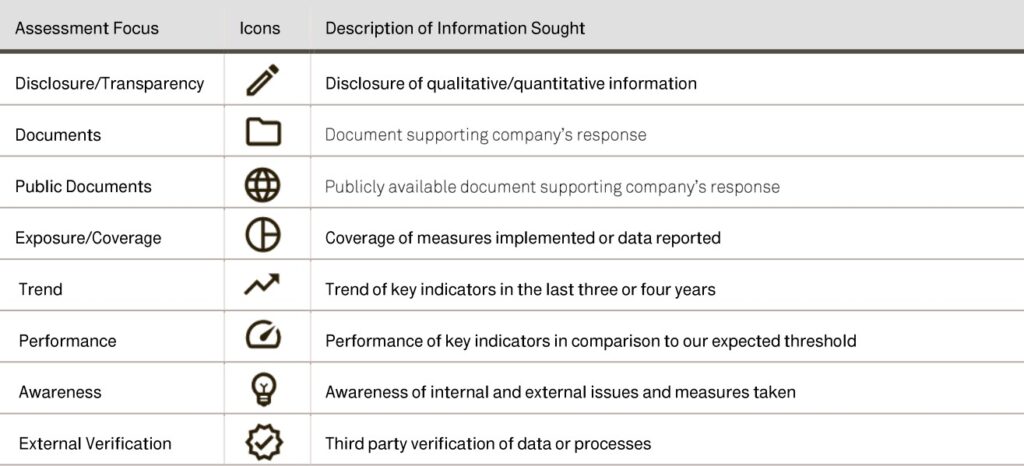
The Corporate Sustainability Assessment (CSA) will ask invited companies about methodologies and rationales of reporting in order to gather information from invited companies for calculating the S&P Global ESG Score, which is a crucial part of the Dow Jones Sustainability Indices (DJSI). CSA provides a guideline, called CSA Handbook, to be a check list for invited companies’ activities. For each covered question, this document provides the Assessment Focus, the Question Rationale, details of the Question Layout and specific guidance on how to answer. Moreover, the Question-Specific Guidance & Definitions sections define the terms that use and provide details on how to interpret and answer each question. They also specify the question’s alignment with the GRI or other standards and framework (Based on GRI mainly), and whether internal or public documents will be necessary to answer the question. The CSA is a holistic assessment, but the structure and weighting of each criterion depends on its financial materiality in a given industry. To aid companies’ preparation for the CSA, it shares the weights for the different aspects of the assessment under CSA Methodology. It also provides general guidance on how to complete the CSA, its expectations and some general tips for a successful submission. Each question in the questionnaire consists of one or more sub-questions. Invited companies are given the possibility of selecting one or more answers to each question. Each question also contains a standard set of answer options that enable you to indicate if a company do not have the information asked for or if the question is not applicable to that company. For the Assessment focus, there are icons to give an indication of what CSA looking for as showed in Figure 4 (S&P Global, 6, 2023).
Figure 4
Invited Companies
Every year more companies see the value of disclosing their sustainability performance to capital markets via active participation in the Corporate Sustainability Assessment (CSA). In 2023, 13,800 companies were invited to complete the CSA. Of those, 3,519 companies were eligible for selection into a Dow Jones Sustainability Index (DJSI). A record number of 1,728 DJSI eligible companies actively participated, an increase of 9% over last year in this group. Of all invited companies, 2,480 have already submitted, representing over 48% of global market capitalization, relative to the S&P Global Broad Market Index (BMI), up from 45% in 2021. The assessment is still ongoing until end of January. Participating companies can choose the degree to which they permit S&P Global to share underlying datapoints submitted in the CSA that are supplemental to the company’s public reporting. The majority of participating companies took advantage of this option to leverage S&P Global’s platforms to communicate this information to a wider capital market audience. To inform the growing number of ESG-focused investors about corporate sustainability performance. Companies will be invited in 3 groups, starting with those eligible for any Dow Jones Sustainability Index (DJSI), then companies will be chosen from 3 factors including:
All companies that participated in the CSA in previous year.
Companies invited as part of the eligible universe of the Dow Jones Sustainability Indices (DJSI), as well as numerous other S&P ESG indices.
Companies whose sustainability performance is considered to be of interest to the broader investment community.
Companies that are invited but decide not to participate may be assessed by S&P Global based on publicly available information, and the resulting ESG Scores and data may be shared via S&P Global platforms. Participation in the CSA is not a prerequisite for eligibility in the DJSI or other S&P ESG Indices. Official invitations will be sent out between February and June. Companies may also check their invitation status via CSA online platform.
Participation without invitation
Any company interested in the CSA that agrees to make their resulting ESG Score public on S&P Global platforms will be assessed free of charge by contact [email protected] for more information. The 2023 CSA questionnaire opens for all companies on April 4th. New for this year, companies are able to select an assessment window that best meets individual reporting schedules. Log in to the CSA Portal to reserve a slot (S&P Global, 7, 2023).
In Thailand, there are currently 26 Thai companies in DJSI, which is the highest number in ASEAN, including ADVANC, AOT, BANPU, BDMS, BJC, BTS, CPALL, CPF, CPN, CRC, DELTA, EGCO, GPSC, HMPRO, IRPC, IVL, KBANK, MINT, PTT, PTTGC, SCB, SCC, SCGP, TOP, TRUE and TU. There are 11 Companies among These 26 companies, which has world class potential to be in DJSI World Family and achieve ESG Index Family (SET, 2022).
S&P Global, 3 (2023) The S&P Global Corporate Sustainability Assessment. [online] New York: S&P Global. Available from: https://www.spglobal.com/esg/csa/about/ [Access 27 July 2023].
the Most Renowned ESG Voluntary Frameworks: Global Real Estate Sustainability Benchmark (GRESB)
GRESB is the global ESG benchmark for financial markets, which is established in 2009 and composed of an independent foundation and a benefit corporation. The GRESB Foundation focuses on the development, approval and management of the GRESB Standards while GRESB BV performs ESG assessments and provides related services to GRESB Members. GRESB is a mission-driven and industry-led organization that provides actionable and transparent environmental, social and governance (ESG) data to financial markets. The 2022 real estate benchmark covers more than 1,800 property companies, real estate investment trusts (REITs), funds, and developers. In addition, GRESB coverage for infrastructure includes over 800 infrastructure funds and assets. Combined, GRESB represents USD 8.6 trillion in real asset value. More than 170 institutional investors use GRESB data to monitor their investments, engage with their managers, and make decisions that lead to a more sustainable real asset industry. Led by a Foundation Board composed of representatives from GRESB Members and Partners, the GRESB Foundation is the primary platform for GRESB to engage with the industry, owning and governing the standards upon which GRESB BV – a separate profit-for-purpose benefit corporation – performs its assessments. The GRESB Foundation, GRESB BV and GRESB Members work as one to deliver a shared vision of an investment community that plays a central role in creating a more sustainable world, one where society can meet the needs of the present without compromising the ability of future generations to meet theirs. As an independent standards-setting body, the GRESB Foundation works to develop, maintain, improve and publish GRESB Standards annually, in time for GRESB BV to perform its assessments.
Specifically, the GRESB Foundation:
Facilitates active industry engagement and consensus on the GRESB Standards
Ensures that the standards are feasible and can be practically implemented
Provides inclusive representation across GRESB Members and Partners
Ensures that the standards continually evolve to advance the foundation’s mission
The GRESB Standards are a set of guidelines to assess and benchmark ESG and related performance of real and other assets. The Standards include the questions, evidence and indicators to assess ESG performance, including the weighting of the indicators. On 14 September 2022, the GRESB Foundation Board approved all the recommended changes for the 2023 GRESB Standards. This is an important outcome of the new GRESB Standards Development Process, which puts the voice and priorities of GRESB members and partners at the forefront of the global ESG realm (GRESB 1, 2023).
Stakeholder Engagement
GRESB’s stakeholder engagement strategy is built on the AA1000 AccountAbility Stakeholder Engagement Standard (2015) and references the ISEAL Alliance Standard-setting Code of Good Practice, which defines how a sustainability standard should be developed, structured and improved over time. To ensure stakeholder engagement is embedded across the organization, GRESB have committed to the AccountAbility principles of inclusivity, materiality, responsiveness and impact. For GRESB, the stakeholder landscape is complex, with some stakeholder groups overlapping others in terms of roles and responsibilities:
Investors, both institutional investors (pension funds, insurance companies, sovereign wealth funds) and other investors (banks, family offices, endowments, etc.)
Real estate & infrastructure entities, including listed property companies, developers, REITs and private funds
Industry associations, such as APREA (Asia Pacific Real Estate Association), ANREV (Asian Association for Investors in Non-Listed Real Estate Vehicles) or ARES Management Corp
Institutions like development banks, central banks, governments, and inter-governmental organizations
ESG framework providers, from both NGOs and the private sector
Inter-governmental initiatives, such as those related to the United Nations
Investor initiatives
Green Building Councils
Certification or rating scheme providers
Consultants either organization or individual
Media and research organizations
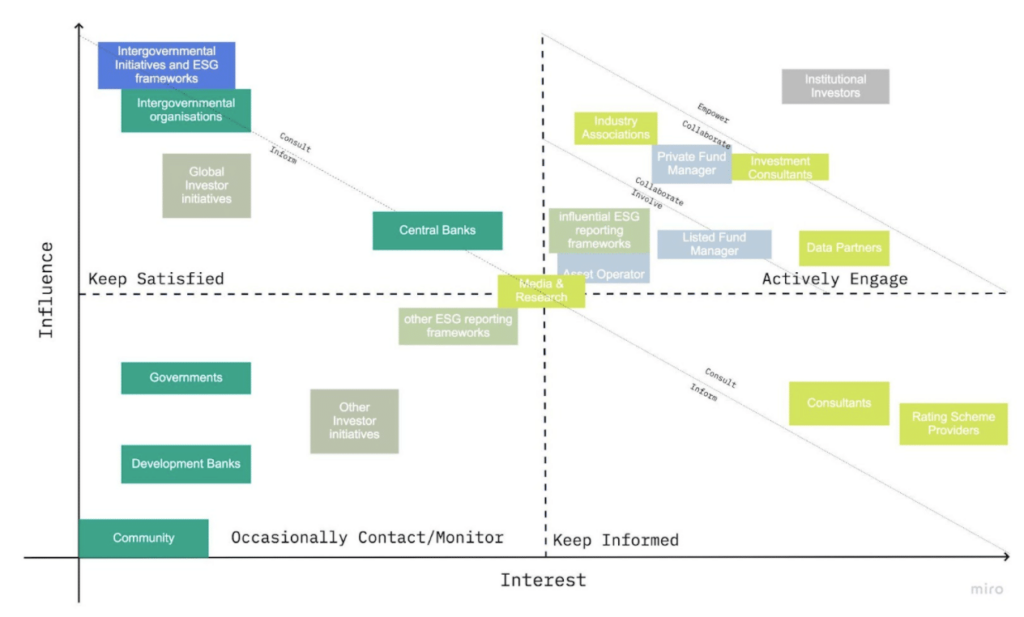
According to GRESB plays an important role within the world of sustainable real assets, and critically engage with the many stakeholders that operate in the ESG space. That said, they cannot and should not engage every stakeholder in the same way or at the same level. Therefore, an “interest-influence” grid helps illustrate our approach, which shows active engagement with GRESB Investor Members, Participant Members and Partners, which is done primarily through the GRESB Foundation as shown in Figure 1.
Figure 1
It can be seen that “influential ESG reporting frameworks” are among our most important stakeholders, just below our own members and partners. For these frameworks, we create bilateral partnerships and engage through representation on various committees and working groups such as Principles for Responsible Investment (PRI) The Global Reporting Initiative (GRI), The Sustainability Accounting Standards Board (SASB), The International <IR> Framework, EU Sustainable Finance Disclosure Regulation (SFDR), Task Force on Climate-related Financial Disclosures (TCFD), Carbon Disclosure Project (CDP) (GRESB 2, 2023). Especially, The EU’s Sustainable Finance Disclosure Regulation (SFDR) is a new transparency requirement for financial market participants related to key environmental, social and governance (ESG) criteria. The purpose is to increase market transparency and direct capital towards more sustainable businesses. SFDR imposes different disclosure obligations on Financial Market Participants, depending on their size and the nature of their products and/ or services. All participants in the EU will need to make general disclosures about sustainability practices for both the entity and their products and/ or services. They will also need to report on their Principle Adverse Impacts (PAIs), which are a series of indicators covering a range of ESG issues, such as greenhouse gas emissions and waste management. At the moment, most companies and funds do not provide disclosures or collect data that is granular enough to satisfy the requirement, once it goes fully in effect, or to provide investors with the level of transparency that is expected by this regulation. GRESB, hence, offers an assessment that provides Financial Market Participants with the framework they need for their Principal Adverse Impact Statement. The Assessment is comprised of around 60 ESG metrics that need to be reported on (GRESB 3, 2023). The SFDR Assessment consists of a number of aspects that a participant is required to report on, including:
Entity and Reporting Characteristics
Climate and other environment-related indicators
Social and employee, respect for human rights, anti-corruption and anti-bribery matters
The SFDR Assessment is broken into 3 parts to reflect the different tables of PAIs as outlined by the EU documentation. The Assessment evaluates performance against three ESG Components – Management, Performance, and Development. The methodology is consistent across different regions, investment vehicles and property types and aligns with international reporting frameworks, such as TCFD, GRI or PRI. The GRESB Real Estate Assessment provides investors with actionable information and tools to monitor and manage the ESG risks and opportunities of their investments, and to prepare for increasingly rigorous ESG obligations. These 3 tables are detailed as follows:
Table 1: Mandatory climate and other environment-related indicators, Social and employee, respect for human rights, anti-corruption and anti-bribery matters.
Table 1 focuses on 14 environmental and social indicators applicable to investments in investee companies and 2 indicators applicable to investments in real estate assets that have to be disclosed by financial market participants, these are considered as part of the “mandatory indicators that have to be reported on”.
Table 1 consists of 16 indicators across 7 aspects:
Greenhouse gas emissions
Biodiversity
Water
Waste
Social and employee matters
Fossil fuels (Real Estate specific indicators)
Energy efficiency (Real Estate specific indicators)
Table 2: Additional climate and other environment-related indicators. These are considered to be optional although participants are encouraged to report on at least one of those indicators in order to abide by regulatory requirements. Table 2 consists of 16 applicable to investment in investee companies and 5 indicators specific to real estate across 9 aspects:
Emissions
Energy performance
Water, waste and material emissions
Green securities
Greenhouse gas emissions (Real Estate specific indicators)
Energy consumption (Real Estate specific indicators)
Waste (Real Estate specific indicators)
Resource consumption (Real Estate specific indicators)
Biodiversity (Real Estate specific indicators)
Table 3: Additional indicators for social and employee, respect for human rights, anti-corruption and anti-bribery matters. These are considered to be optional although participants are encouraged to report on at least one of those indicators in order to abide by regulatory requirements. Table 3 consists of 17 indicators across 3 aspects:
Social and employee matters
Human rights
Anti-corruption and anti-bribery
Those issues in 3 Tables are reported through following tools (online) that help participants with the submission process:
Assessment Access Tool: A participating property company or fund manager can invite colleagues, advisors and consultants to register in the Portal to assist with the submission of data to GRESB.
Asset-level data tools: GRESB has developed a number of tools to assist participants with the collection and aggregation of asset-level data that is required to complete the SFDR Assessment.
The Portal has real-time error detection systems and warnings (GRESB 4, 2023).
The tools are designed to streamline data flows and increase data quality. For example,
Application Programming Interface (API): This tool is available through an increasing number of data providers. It allows participants to seamlessly feed information from a data provider’s data collection system to the GRESB Portal, automatically completing some of the indicators in tables 1 and 2 of the SFDR Real Estate Assessment. The full list of data partners can be found in GRESB Partner Directory (GRESB 5, 2023).
GRESB Asset Spreadsheet: Participants who do not have access to the Automated Data Feed can upload asset data to the GRESB Asset Portal using the Asset Spreadsheet. Please check the SFDR Assessment Instructions tab of the Asset Spreadsheet for more information (GRESB 6, 2023).
*Note that the term table is used as a reference point to the mandatory and optional indicators as per the template provided by the EU but that the SFDR Assessment Portal itself is not composed of ‘’tables’’. The SFDR report will however be in table format.
The goal of the GRESB Assessments is to capture the most material ESG data related to the sustainability performance of real estate and infrastructure companies and assets. This data and the insights derived from it are used by investors to assess organizational exposure to various risks and to identify new opportunities to invest in strong-performing companies. For a detailed description of the new governance structure, the GRESB Standards Development Process, and the changes for the 2023 GRESB Standards, by relating more to external frameworks as showed in Table 1.
Real Estate
Infrastructure
IR Framework
CDP
CDP
PRI
SASB
GRI
GRI
SASB
PRI
Table 1
For each external framework, GRESB created an analysis table with the framework’s relevant indicators, which were mapped to specific indicators from the relevant GRESB’s standards. From this, GRESB analyzed the level of alignment between the GRESB indicators and those from the external framework (GRESB 7, 2023). GRESB collects, validates, scores, and independently benchmarks ESG data to provide business intelligence, engagement tools, and regulatory reporting solutions for investors, and asset managers in the wider industry. GRESB provides a rigorous methodology and consistent framework to measure the ESG performance of individual assets and portfolios based on self-reported data. Performance assessments are guided by what investors and the wider industries consider to be material issues, and they are aligned with the Sustainable Development Goals, the Paris Climate Agreement and major international reporting frameworks. Through a GRESB Membership, data is reported to the relevant GRESB Assessment each year on a regular cycle and are validated by a third party and scored before being used to generate the following ESG benchmarks for the industry:
Real Estate Benchmark
Real Estate Development Benchmark
Infrastructure Fund Benchmark
Infrastructure Asset Benchmark
Each year, GRESB publishes the global aggregated benchmark data showing the state of ESG in the industry. The benchmark itself evolves over time, ensuring that scores reflect relative performance and evolving sustainability expectations (GRESB 8, 2023).
GRESB 1 (2023) GRESB Foundation. [online] Amsterdam: Global Real Estate Sustainability Benchmark. Available from: https://www.gresb.com/nl-en/gresb-foundation/ [Accessed on 17 July 2023].
GRESB 4 (2023) GRESB Documents. [online] Amsterdam: Global Real Estate Sustainability Benchmark. Available from: https://documents.gresb.com/ [Accessed on 17 July 2023].
GRESB 5 (2023) Partner Directory. [online] Amsterdam: Global Real Estate Sustainability Benchmark. Available from: https://www.gresb.com/nl-en/gresb-partners/ [Accessed on 22 July 2023].
GRESB 6 (2023) GRESB Real Asset Spreadsheet. [online] Amsterdam: Global Real Estate Sustainability Benchmark. Available from: https://www.gresb.com/nl-en/?s=asset+spreadsheet [Accessed on 22 July 2023].
GRESB 8 (2023) How We Work. [online] Amsterdam: Global Real Estate Sustainability Benchmark. Available from: https://www.gresb.com/nl-en/about-us/ [Accessed on 17 July 2023].
the Most Renowned ESG Guidance Frameworks: Value Reporting Foundation (VRF)
The VRF’s SASB Standards serve as a key starting point for the development of the IFRS Sustainability Disclosure Standards, while the Integrated Reporting Framework provides connectivity between financial statements and sustainability-related financial disclosures. The consolidation delivers on market demand—including from companies, investors and regulators—for simplification of the sustainability disclosure landscape, and follows the consolidation of the Climate Disclosure Standards Board (CDSB) into the IFRS Foundation (IFRS, 1., 2022). The VRF unites the IIRC’s historic focus on enabling management and business decision-making with SASB’s historic focus on enabling investor decision-making. The two organizations share a core belief that external reporting can create a common language among businesses and investors and help both businesses and investors understand how value is created, preserved or eroded over time. The Value Reporting Foundation’s three resources comprise a robust toolset:
Integrated Thinking Principles drive an improved understanding of how value is created, to enhance decision-making and actions by boards and management. Through integrated thinking, organizations are better placed to tailor their business model and strategy to respond to the external environment and understand risks and opportunities.
<IR> Framework is a principles-based framework that guides effective communication on strategy, governance, performance and prospects through a multi-capital lens, enabling a single integrated report that communicates a business’s holistic value.
SASB Standards provide detailed industry-specific sets of disclosure topics and metrics to inform what content to include in an integrated report, lending insight into performance on the subset of sustainability issues that are most closely tied to an organization’s ability to create long-term value, and thus most of interest to investors.
When used together, tools from the Value Reporting Foundation create a perpetual feedback loop, enabling businesses and investors to more effectively communicate on enterprise value and how it is created, preserved or eroded over time. Across the globe, organizations are increasingly leveraging the complementary benefits of the <IR> Framework and SASB Standards as shown in Figure 1.
Figure 1
Clarifying compatibility across the Value Reporting Foundation Tools
The <IR> Framework and the SASB Standards are complementary, and many businesses use both to fulfill their reporting needs. The tools provide a powerful structure for reporting qualitative context and activity alongside quantitative industry-specific metrics. Within the growing field of sustainability-related disclosure, frameworks and standards have been developed to help establish a foundational layer of relevant, comparable and reliable information from companies. Each serves a unique purpose to help companies understand and report on critical drivers of long-term value.
Disclosure frameworks, including the <IR> Framework, provide broad content and presentation requirements through a principles-based approach.
Disclosure standards, including SASB Standards, provide replicable and detailed requirements for what should be reported for specific topics. Standards support frameworks by ensuring comparable, consistent and reliable information.
The <IR> Framework helps companies explain how they create, preserve or erode value. Applying well-defined Guiding Principles and Content Elements, integrated reports look beyond financial performance alone to demonstrate how businesses manage up to 6 forms of capital: financial, manufactured, intellectual, human, social and relationship, and natural. Integrated reporting offers internal and external benefits. Internally, it builds communication and coordination across departments. It improves internal decision-making through building a deeper understanding of the resources and relationships that are critical to the long-term success of the business. Integrated reporting also enables an organization to evaluate its governance, performance and prospects in the context of the external environment, and provide investors and other users of integrated reports with a more holistic view of the business. SASB Standards complement the <IR> Framework’s principles-based approach. An integrated report provides essential context to investors, helping them more fully understand the business’ current position, future prospects and the relevant circumstances under which performance has been achieved. This provides investors with insight into the quality of thinking and strategic planning of the board and management. However, an integrated report, a concise and connected narrative, offers valuable explanations and context for the data provided through SASB Standards. On the other hand, SASB Standards identify the subset of environmental, social, and governance (ESG) issues likely to materially impact the financial performance of a typical business in an industry. By starting with this subset of issues, businesses can establish best practices, produce decision- useful reports, and then seek to improve disclosure and performance year on year. Available for 77 industries, SASB Standards provide investors with consistent, comparable and reliable information on the ESG factors most relevant to financial performance and enterprise value. With an average of six disclosure topics and 13 disclosure metrics per industry, the SASB Standards are an accessible starting point for companies beginning their ESG reporting journey. Many businesses using both the <IR> Framework and SASB Standards find that the two tools strengthen one another. Furthermore, SASB Standards provide comparable information on the business-critical risks and opportunities that fall beyond the scope of traditional financial disclosure.
Internal business benefits
The corporate disclosure has been described as complex and confusing for businesses. The breadth of reporting frameworks and standards can strain a company’s resources. Amidst this broad reporting landscape, the <IR> Framework and SASB Standards provide an efficient solution. These tools provide companies with a robust system that integrates sustainability disclosure with financial disclosure practices. The <IR> Framework and SASB Standards provide an accessible starting point to high-quality, investor- focused disclosure. With the <IR> Framework, organizations can understand and communicate how their resources (capitals) are changed through business activities to create value over time. With SASB Standards, companies can report on the ESG information most critical to their industry and enable comparability. While certain information is useful across industries, many sustainability-related value drivers are industry-specific. By adding SASB Standards, reporters provide: 1) industry-specific rigor; 2) quantitative evidence/ support for the integrated report’s narrative claims; and 3) deeper comparability against peers. For example, with SASB Standards, Badische Anilin and Sodafabrik (BASF) can succinctly highlight the sustainability topics most material to the Chemicals industry (such as Hazardous Waste Management), and Unilever, a UK-based consumer goods provider, can do the same for the topics in the Household & Personal Products industry (such as Environmental & Social Impacts of Palm Oil Supply Chain). (SASB Standards, 2021).
External business and investor benefits
With the <IR> Framework and SASB Standards, businesses can provide a more complete picture of long-term value creation while meeting investor needs for comparable, consistent and reliable information. Reporting with both tools can bolster a company’s credibility and trust among its external stakeholders, especially investors and other providers of financial capital. Investors are not monolithic — they have varying strategies and priorities. To best meet investor needs, businesses should engage with their investors directly, understand their priorities, and then tell the company story with that lens in mind. The <IR> Framework and SASB Standards are useful tools to strengthen, enhance and clarify a business’ value creation story. BASF conducted an “ESG to value creation” mapping exercise to help prioritize and disseminate sustainability practices and initiatives. In particular, with the issuance of its first green bond in 2020, BASF found that reporting and performance improvements subsequently increased its access to financial capital. While green bonds are an uncommon offering for a chemical business, BASF turned it into a successful financing tool. In many ways BASF attributes this success to its reporting with the <IR> Framework. Investors credited their support for the BASF green bond to a strong trust in BASF’s business and ESG practices. Investors feedback further underlined that this trust arose from the company’s reporting and how investors are able to see financially-relevant sustainability issues integrated into management of the business. Due to high investor demand for consistent, comparable and reliable ESG data, businesses find that disclosing with SASB Standards has a positive effect on investor relations. Because they are industry-specific, metric-driven and focused on financial materiality, SASB Standards enable integration of ESG considerations into investment and stewardship decisions across global portfolios and asset classes. They also provide comparable data to the data and analytics ecosystem that supports investment decision making.
Communicating Inside and out
Disclosure with the <IR> Framework and SASB Standards creates a positive feedback loop between businesses and investors. Used in conjunction, this positive feedback loop helps communicate progress and facilitate further improvement over time. When a business is clear about its sustainability objectives, the reporting process, using the <IR> Framework and SASB Standards, creates a positive feedback loop as shown in Figure 2.
Figure 2
Incorporating feedback will look different at every organization. It may result in the review of corporate strategy, adaptation of management systems or evolution of governance processes. In all scenarios, the feedback loop will ensure that resources are allocated efficiently to maximize value over the short, medium and long term. Many businesses describe this holistic approach as integrating ESG or sustainability into their DNA. In the same way that sustainability issues manifest differently for every industry, integrating ESG across internal business units looks different for every business. Disclosure with the <IR> Framework and the SASB Standards is far more than a communications exercise. Within a business, these tools can help break down internal barriers, build connectivity and enhance decision-making. This promotes integrated thinking, a process by which boards and management teams gain new insights into their organization’s value creation process. They improve their understanding of the resources and relationships (or capitals) on which the organization depends, the risks it faces and the financial and non-financial outcomes it generates.
Contributing to a more sustainable future
Disclosure and transparency are a means to an end: more informed business and investment decision making that can lead to improved economic, environmental and societal outcomes. Businesses engaging in sustainability disclosure and integrated reporting are embarking on a continuous journey, an interactive cycle, which benefits their business, their investors, society and the planet as shown in Figure 3.
the Most Renowned ESG Guidance Framework: International Integrated Reporting Council (IIRC)
The International Integrated Reporting Council (IIRC) was found in August 2010 and aims to create a globally accepted framework for process that results in communications by an organization about value creation over time. The IIRC Board of Directors oversaw the strategy, finances, and operations of the organization and appointing members of the International Integrated Reporting Framework Board. The International Integrated Reporting Framework Board recommended any revision, modification or other updates to the International Integrated Reporting Framework Council. The Council was the primary institutional forum for expression of the broad market view on matters relating to integrated reporting and integrating thinking, as well as a medium for its interaction and provision of advice, guidance and input on issues of relevance for the organization, including its nature, objectives, purpose, vision and mission, as well as its strategy and the means by which to deliver integrated reporting framework to the market (Integrated Reporting, 1., 2023). In November 2011, the IIRC announced a number of changes to its organizational structure according to its complexity. Under the new arrangements, an initial transitional phase until the end of 2013 will see the IIRC supported by a strengthened secretariat operating through a not-for-profit company established for the purpose under the same name. A Governance Committee has also been established for replacing the original, with responsibilities relating to audit, nominations, and executive remuneration for the company. At this point, the IIRC Created the foundations for a new reporting model to enable organizations to provide concise communications of how they create value overtime in 2014. The IIRC refers to this process as Integrated Reporting, which it stylizes as <IR>. <IR> structured around the organization’s strategic objectives, its governance, and business model and integrating both financial and non-financial information. The objectives for an integrated reporting framework are to:
Support the information needs of long-term investors, by showing the border and long-term consequences of decision making
Reflect the interconnections between environmental, social, governance and financial factors in decisions that affect long-term performance and condition, making clear the link between sustainability and economic value
Provide the necessary framework for environmental and social factors to be taken into account systematically in reporting and decision making
Rebalance performance metrics away from an undue emphasis on short term financial performance
Bring reporting closer to the information used by management to run the business on day-to-day basis
(UK Accounting Plus, 2023) and <IR> aims to:
Improve the quality of information available to providers of financial capital to enable a more efficient and productive allocation of capital
Promote a more cohesive and efficient approach to corporate reporting that draws on different reporting strands and communicates the full range of factors that materially affect the ability of an organization to create value over time
Enhance accountability and stewardship for the broad base of capitals (financial, manufactured, intellectual, human, social and relationship, and natural) and promote understanding of their interdependencies
Support integrated thinking, decision-making and actions that focus on the creation of value over the short, medium and long term.
The <IR> framework is divided into 3 parts including Fundamental Concepts, Guidance Principles, and Content Elements. Firstly, the Fundamental Concepts underpin and reinforce the requirements and guidance in the <IR> Framework. It explains how an organization crates, preserves, or erodes value over time. Value is not created, preserved, or eroded by or within an organization alone, it is influenced by the external environment though. It, in addition, is created through relationships with stakeholders on various resources as following:
Value creation, preservation or erosion for organization and for others Value created, preserved or eroded by an organization over time manifests itself in increases, decreases or transformations of the capitals caused by the organization’s business activities and outputs. The ability of an organization to create value for itself is linked to the value it creates for others. As illustrated in Figure 1
Figure 1
The capitals All organizations depend on various forms of capital for their success. In the <IR> Framework, the capitals comprise financial, manufactured, intellectual, human, social and relationship, and natural
Process through which value is created, preserved, or eroded although organizations aim to create value, the overall stock of capitals can also either undergo a net decrease or experience no net change. In such cases, value is eroded or preserved. The process through which value is created, preserved or eroded is depicted in Figure 2 (Integrated Reporting, 2., 2021)
Figure 2
7 combination guidance principles underpin the operation and presentation of an integrated report, informing the content of the report and how information is presented:
Strategic focus and future orientation. An integrated report should provide insight into the organization’s strategy, and how it relates to the organization’s ability to create value in the short, medium and long term, and to its use of and effects on the capitals
Connectivity of information. An integrated report should show a holistic picture of the combination, interrelatedness and dependencies between the factors that affect the organization’s ability to create value over time
Stakeholder relationships. An integrated report should provide insight into the nature and quality of the organization’s relationships with its key stakeholders, including how and to what extent the organization understands, takes into account and responds to their legitimate needs and interests
Materiality. An integrated report should disclose information about matters that substantively affect the organization’s ability to create value over the short, medium and long term
Conciseness. An integrated report should be concise
Reliability and completeness. An integrated report should include all material matters, both positive and negative, in a balanced way and without material error
Consistency and comparability. The information in an integrated report should be presented: (a) on a basis that is consistent over time; and (b) in a way that enables comparison with other organizations to the extent it is material to the organization’s own ability to create value over time.
The <IR> also comprises of 8 content elements that are fundamentally linked to each other and are not mutually exclusive:
Organizational overview and external environment. What does the organization do and what are the circumstances under which it operates?
Governance. How does the organization’s governance structure support its ability to create value in the short, medium and long term?
Business model. What is the organization’s business model?
Risks and opportunities. What are the specific risks and opportunities that affect the organization’s ability to create value over the short, medium and long term, and how is the organization dealing with them?
Strategy and resource allocation. Where does the organization want to go and how does it intend to get there?
Performance. To what extent has the organization achieved its strategic objectives for the period and what are its outcomes in terms of effects on the capitals?
Outlook. What challenges and uncertainties are the organization likely to encounter in pursuing its strategy, and what are the potential implications for its business model and future performance?
Basis of presentation. How does the organization determine what matters to include in the integrated report and how are such matters quantified or evaluated?
In 2021, the IIRC merged with the Sustainability Accounting Standard Board (SASB) Foundation into the Value Reporting Foundation (VRF). The IIRC Board of Directors and the SASB Foundation Board of Directors combined to form the Value Reporting Foundation Board of Directors (“the VRF Board”). A governing board, the VRF Board was responsible for overseeing the strategy, finances, and operations of the organization and appointing members of the International Integrated Reporting Framework Board (IIRF) (Integrated Reporting, 2021). Then in 2022, The IFRS Foundation announced the completion of the consolidation of the Value Reporting Foundation (VRF) into the IFRS Foundation. The IFRS Foundation’s International Accounting Standards Board (IASB) and the International Sustainability Standards Board (ISSB) will work together to agree on how to build on and integrate the Integrated Reporting Framework into their standard setting projects and requirements. It follows the commitment made at COP26 to consolidate staff and resources of leading global sustainability disclosure initiatives to support the IFRS Foundation’s new International Sustainability Standards Board’s (ISSB) work to develop a comprehensive global baseline of sustainability disclosures for the capital markets. The <IR> helps businesses think holistically about their strategy to build investor and key stakeholder confidence and improve future performance. With integrated reporting now being adopted in 75 countries worldwide, by over 2,500 organizations and with support from 40 stock exchanges and counting, more and more organizations are experiencing its benefits for business decision-making and long-term value creation. (Integrated Reporting, 3., 2021).